Ā
Scalar Network Analyzer
A scalar network analyzer is a type of network analyzer and a direct descendant of a "wobbulator" or sweeper.
These devices use a swept frequency oscillator to produce data on a device under test.
The RF sweep of a filter can produce an output to an oscilloscope displaying a curve
of the filter. A spectrum analyzer with a tracking generator performs the function of
a scalar network analyzer. The difference between a scalar network analyzer and a vector network
analyzer is that the VNA provides amplitude and phase information,
where the SNA provides only amplitude information.
George Steber, WB9LVI evaluated a low cost commercial SNA in the November/December 2018
edition of QEX. The NTW70 unit is listed on eBay as of January 2019 as low as $82.
What's the difference between
a Network Analyzer and a Spectrum Analyzer?
RF network analyzers characterize and measure the response of a device under test (DUT).
Network analyzers measure the broadband frequency by sweeping power and frequency.
Scalar Network Analyzer vs. Vector Network Analyzer
Both the SNA and VNA create a signal and use tuned receivers over a range of
frequencies to characterize the DUT, including reflection and insertion loss.
A scalar network analyzer (SNA) measures the amplitude properties of the
incident and reflected waves including insertion loss, gain,
return loss and SWR of the device under test (DUT).
A vector network analyzer (VNA) measures amplitude and other properties
including phase characteristics of incident and reflected waves including phase delay,
group delay and S-parameters at the ports of the device under test (DUT).
Using vector analysis the impedance of a network can be calculated. Many VNAs including the nanoVNA can produce impedance presentations through Smith chart displays with the software.
Difference between SNA, VNA and Spectrum Analyzer (SA)
A spectrum analyzer measures the the spectral content of a signal, which is the
strength of a signal (amplitude) in the frequency domain, including carrier
power level, noise harmonics, distortion and bandwidth.The SA uses only a
frequency sweep for measurement. SAs are commonly configured
without a signal source, but they may contain an onboard or separate tracking
generator for certain tests.
This is in contrast to the RF network analyzers, which measure characteristics
of a device under test, including reflection coefficient, and insertion and
return loss, and for the VNA, S-parameters.
When used for testing filter circuits, an SA can be used along with a tracking
generator to measure amplitude only, thus acting in the role of a scalar network analyzer. Note that the popular low cost tinySA can be used with a second tinySA as a tracking generator.
Some modern digital oscilloscopes can serve as a spectrum analyzer by using its
FFT (Fast Fourier Transform) function.
Some SDRs (software-defined receivers) can perform SA functions via special
software, including the RSPx-series SDRs.
In the case of testing filters, a scalar network analyzer can possibly
provide the filter characteristics with more precision than a
tinySA + tracking generator combination, or than a nanoVNA, which is
normally limited to 100 Hz resolution.
In the case of the PHSNA, it can generate a frequency sweep with
1 Hz resolution if necessary for determining characteristics of a single
crystal, or over the range of a crystal filter for a Bode plot.
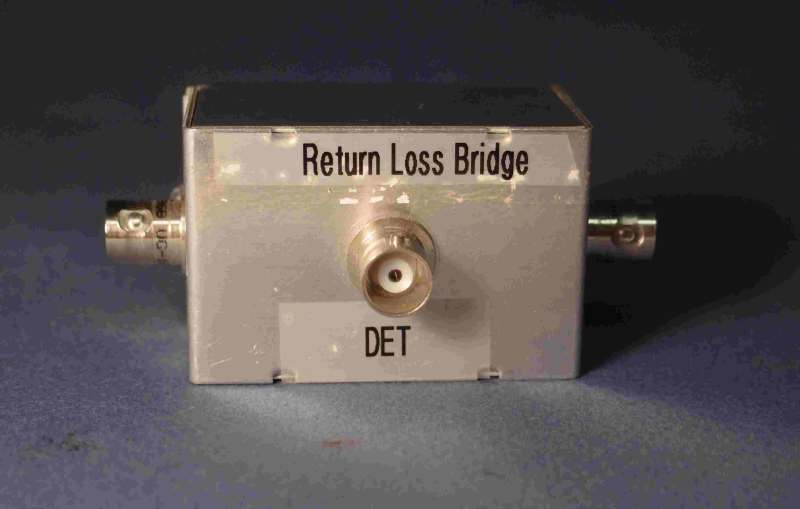
A more reasonable setting would be used for sweeping an antenna for a plot
of SWR along with a return loss bridge.
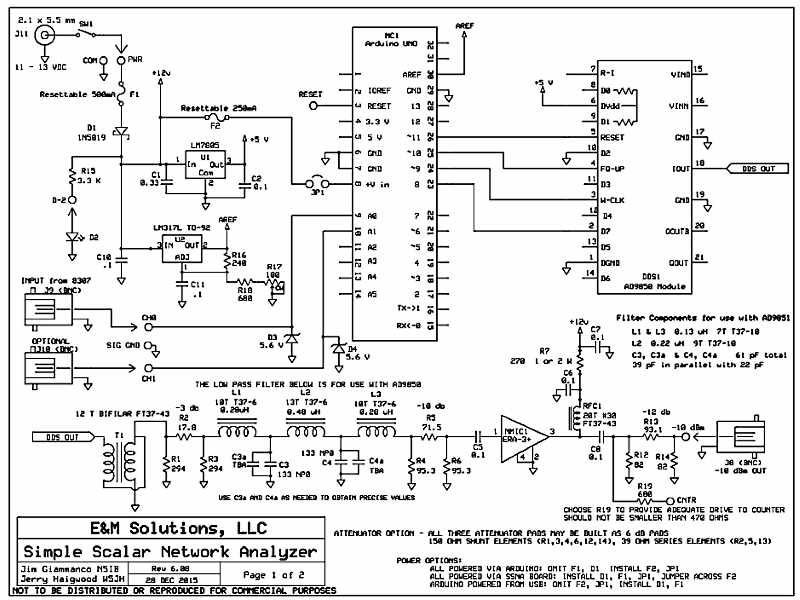
The Poor Ham's Scalar Network Analyzer was developed by a group of amateur radio hobbyists. The designs of the equipment for the project was published initially on a Yahoo group, and subsequently moved to groups.io, the PHSNA group. PC board designs were produced by the group, and group buys of the various boards were done. Many participants also made their own PC boards. The open source nature of the information also spun off some commercial projects, including George Heron, N2APB's Midnight Design Solutions MSNA Scalar Network Analyzer, a hand-held unit. The leads for the PHSNA project were Jim Giammanco, N5IB and Jerry Haigwood, W5JH.
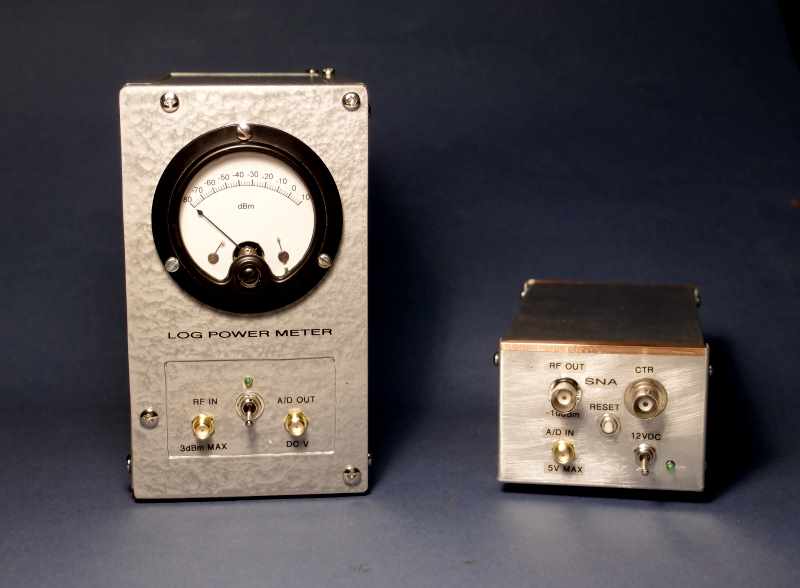
The basic functional units of the PHSNA are the sweeper/analyzer and the log power meter, which produces analog DC voltage proportional to the RF signal voltage translated to dBm. The "SNA" unit consists of a control board, an Arduino, and a DDS device in a three-board stack. The project was developed around the Arduino Uno and the smaller Arduino Nano, which have identical functionality for the SNA. The inexpensive AD9850 and AD9851 modules found on eBay are used as the synthesizer. Arduino code was developed and a Windows executable application was written to provide input and output.
The log power meter that I built for the PHSNA is functionally the same as the original LPM I built several years ago. It is heavier due to its steel enclosure (a vertical PC power supply case) and a battery pack I built with 6 AA cells. I used a 50 uA Weston meter that I had on hand rather than the 1 mA meter in the other one. The LPMs perform the same.
The software for the PHSNA was developed by Nick Kennedy, WA5BDU. Nick wrote an article in Spring 2014 QRP Quarterly on the PHSNA that is downloadable from his website at pages.suddenlink.net/wa5bdu. The PHSNA User's Guide is downloadable from the Files section of https://groups.io/g/PHSNA. Registration is required.
Below are photos of the modules of the PHSNA.
Click to enlarge. Included are graphs of my 40m dipole and an upgraded Heathkit crystal filter for my HW-101.
I bought that 404-283 SB-101 filter on eBay, and it has a much better shape factor than the 404-328 that comes with the HW-101.
For the sweep, I built a simple jig with an L-C network at each end to match the 2,000 ohm filter termination
resistance to 50 ohms for the SNA sweep.
The data produced as a text file
in .csv format can be converted to Microsoft Excel for further analysis and charts. The application also
produces sweeps directly as JPG (and other formats) for viewing within the application or for saving.
When viewed as a chart in Excel, moving the mouse over the chart brings up each data point from
the chart; with 1 Hz resolution of the sweep of the in the case of the Heathkit crystal filter.
LPM and SNA
LPM meter scale

SNA schematic
CMOS calibration oscillator

Sine wave calibration oscillator

Return loss bridge
40m dipole sweep

Heathkit 404-283 Xtal filter sweep
